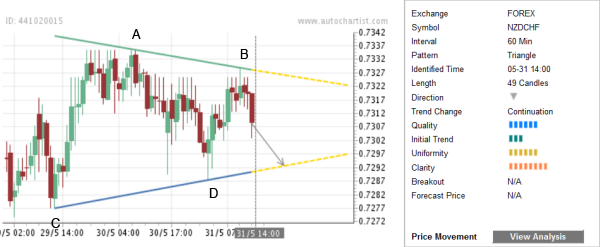
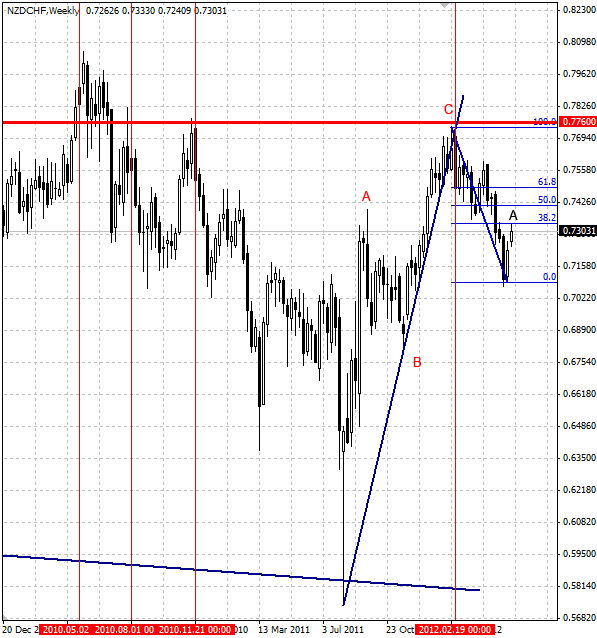
Autochartist has recently identified the well-formed Triangle chart pattern on the hourly NZD/CHF charts. The overall Quality of this Triangle is measured at the 6 bar level – which reflects the following values of the individual contributing Quality indicators: low Initial Trend (rated at the 3 bar level), above-average Uniformity (6 bars) and near-maximum Clarity (8 bars). This chart pattern continues the prevailing downtrend visible on the weekly NZD/CHF charts. More specifically, this chart pattern continues the proceeding sharp daily downward price thrust from the major resistance level 0.7760 (this impulse broke through the support trendline of the previous upward ABC correction in the February of this year, as is shown on the second chart below). The top of this Triangle (point A on the chart below) formed at the 38,2% Fibonacci Retracement of the aforementioned preceding downward price impulse from 0.7760. The pair is expected to fall further in the nearest time.

The following weekly NZD/CHF chart shows the technical price levels mentioned above:
 NZD/CHF" title="NZD/CHF" width="597" height="638" />

The following weekly NZD/CHF chart shows the technical price levels mentioned above:
 NZD/CHF" title="NZD/CHF" width="597" height="638" />
3rd party Ad. Not an offer or recommendation by Investing.com. See disclosure here or remove ads.
Which stock should you buy in your very next trade?
AI computing powers are changing the stock market. Investing.com's ProPicks AI includes 6 winning stock portfolios chosen by our advanced AI. In 2024 alone, ProPicks AI identified 2 stocks that surged over 150%, 4 additional stocks that leaped over 30%, and 3 more that climbed over 25%. Which stock will be the next to soar?
Unlock ProPicks AI