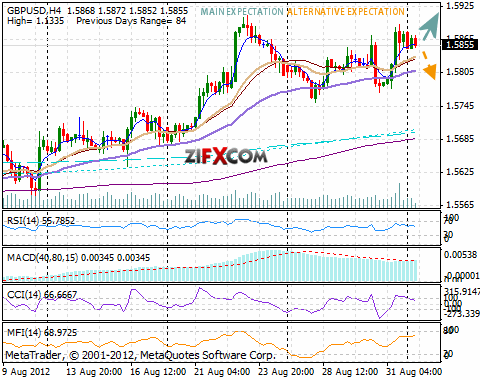
GBP/USD Open 1.5786 High 1.5896 Low 1.5777 Close 1.5869
On Friday GBP/USD increased with 120 pips. The cable appreciated from 1.5777 to 1.5896 on Friday, in line with the positive money flow sentiment at almost nearly +19%, closing the 5869 at 1.5783. Today the British pound is trading quietly, with movements at the upper end of Friday's range for the time being.
On the 1-hour the upward channel is still on hold, while on the 3-hour chart small angle upward channel has formed. First resistance is Friday's peak at 1.5896. Break above it should extend the bullish movement further towards 1.6020. The nearest support level is Friday's bottom at 1.5777. Going below it should extend British pound's reduction further down towards next downward objective 1.5655.
Today is UK CIPS manufacturing index at 8:30 GMT.
Quotes are moving just above the 20 and 50 EMA on the 1-hour chart, indicating slim bullish pressure. The value of the RSI indicator is thinly positive and calm, MACD is positive and tranquil, while CCI has crossed up the 100 line on the 1-hour chart, giving over all light long signals.
Technical resistance levels: 1.5896 1.6020 1.6152
Technical support levels: 1.5777 1.5655 1.5520
 GBP/USD Chart" title="GBP/USD Chart" />
On Friday GBP/USD increased with 120 pips. The cable appreciated from 1.5777 to 1.5896 on Friday, in line with the positive money flow sentiment at almost nearly +19%, closing the 5869 at 1.5783. Today the British pound is trading quietly, with movements at the upper end of Friday's range for the time being.
On the 1-hour the upward channel is still on hold, while on the 3-hour chart small angle upward channel has formed. First resistance is Friday's peak at 1.5896. Break above it should extend the bullish movement further towards 1.6020. The nearest support level is Friday's bottom at 1.5777. Going below it should extend British pound's reduction further down towards next downward objective 1.5655.
Today is UK CIPS manufacturing index at 8:30 GMT.
Quotes are moving just above the 20 and 50 EMA on the 1-hour chart, indicating slim bullish pressure. The value of the RSI indicator is thinly positive and calm, MACD is positive and tranquil, while CCI has crossed up the 100 line on the 1-hour chart, giving over all light long signals.
Technical resistance levels: 1.5896 1.6020 1.6152
Technical support levels: 1.5777 1.5655 1.5520
 GBP/USD Chart" title="GBP/USD Chart" />
3rd party Ad. Not an offer or recommendation by Investing.com. See disclosure here or remove ads.
Which stock should you buy in your very next trade?
AI computing powers are changing the stock market. Investing.com's ProPicks AI includes 6 winning stock portfolios chosen by our advanced AI. In 2024 alone, ProPicks AI identified 2 stocks that surged over 150%, 4 additional stocks that leaped over 30%, and 3 more that climbed over 25%. Which stock will be the next to soar?
Unlock ProPicks AI