
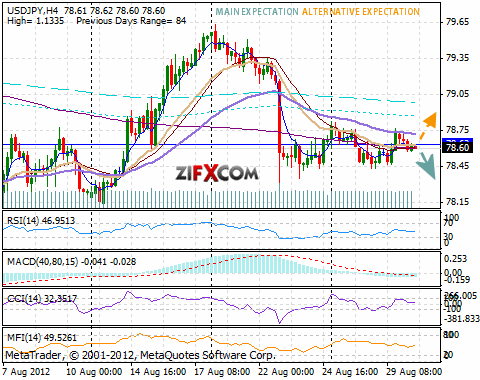
USD/JPY Open 78.72 High 78.79 Low 78.47 Close 78.69
On Wednesday USD/JPYcontinued trading within narrow 30 pip range. The currency couple appreciated from 78.47 to 78.79 yesterday, matching the neutral money flow sentiment at around 7%, closing the day at 78.69. This morning the dollar is trading quietly against the yen, with movements within yesterday's range for now.
On the 1-hour chart range trading has formed, while on the 3-hour chart quotes are still moving within wider range. Break above yesterday's top and nearest resistance 78.79 would encourage further recovery of the dollar. Immediate support is yesterday's bottom at 78.47, and consistent break below it could strengthen the yen further down towards next target 77.56.
Today are Japan Nationwide and Tokyo area CPI, Household spending, Unemployment, and Industrial output, at 23:30 and 23:50 GMT respectively.
Quotes are moving just above the 20 and below the 50 EMA on the 1-hour chart, indicating short term slim bullish and medium-term bearish pressure. The value of the RSI indicator is neutral and calm, MACD is neutral and tranquil too, while CCI has thinly crossed up the 100 line on the 1-hour chart, giving over all neutral signals.
Technical resistance levels: 78.79 79.70 80.54
Technical support levels: 78.47 77.56 76.70
 USD/JPY Chart" title="USD/JPY Chart" />
On Wednesday USD/JPYcontinued trading within narrow 30 pip range. The currency couple appreciated from 78.47 to 78.79 yesterday, matching the neutral money flow sentiment at around 7%, closing the day at 78.69. This morning the dollar is trading quietly against the yen, with movements within yesterday's range for now.
On the 1-hour chart range trading has formed, while on the 3-hour chart quotes are still moving within wider range. Break above yesterday's top and nearest resistance 78.79 would encourage further recovery of the dollar. Immediate support is yesterday's bottom at 78.47, and consistent break below it could strengthen the yen further down towards next target 77.56.
Today are Japan Nationwide and Tokyo area CPI, Household spending, Unemployment, and Industrial output, at 23:30 and 23:50 GMT respectively.
Quotes are moving just above the 20 and below the 50 EMA on the 1-hour chart, indicating short term slim bullish and medium-term bearish pressure. The value of the RSI indicator is neutral and calm, MACD is neutral and tranquil too, while CCI has thinly crossed up the 100 line on the 1-hour chart, giving over all neutral signals.
Technical resistance levels: 78.79 79.70 80.54
Technical support levels: 78.47 77.56 76.70
USD/JPY Chart" title="USD/JPY Chart" />3rd party Ad. Not an offer or recommendation by Investing.com. See disclosure here or remove ads.
Which stock should you buy in your very next trade?
With valuations skyrocketing in 2024, many investors are uneasy putting more money into stocks. Unsure where to invest next? Get access to our proven portfolios and discover high-potential opportunities.
In 2024 alone, ProPicks AI identified 2 stocks that surged over 150%, 4 additional stocks that leaped over 30%, and 3 more that climbed over 25%. That's an impressive track record.
With portfolios tailored for Dow stocks, S&P stocks, Tech stocks, and Mid Cap stocks, you can explore various wealth-building strategies.